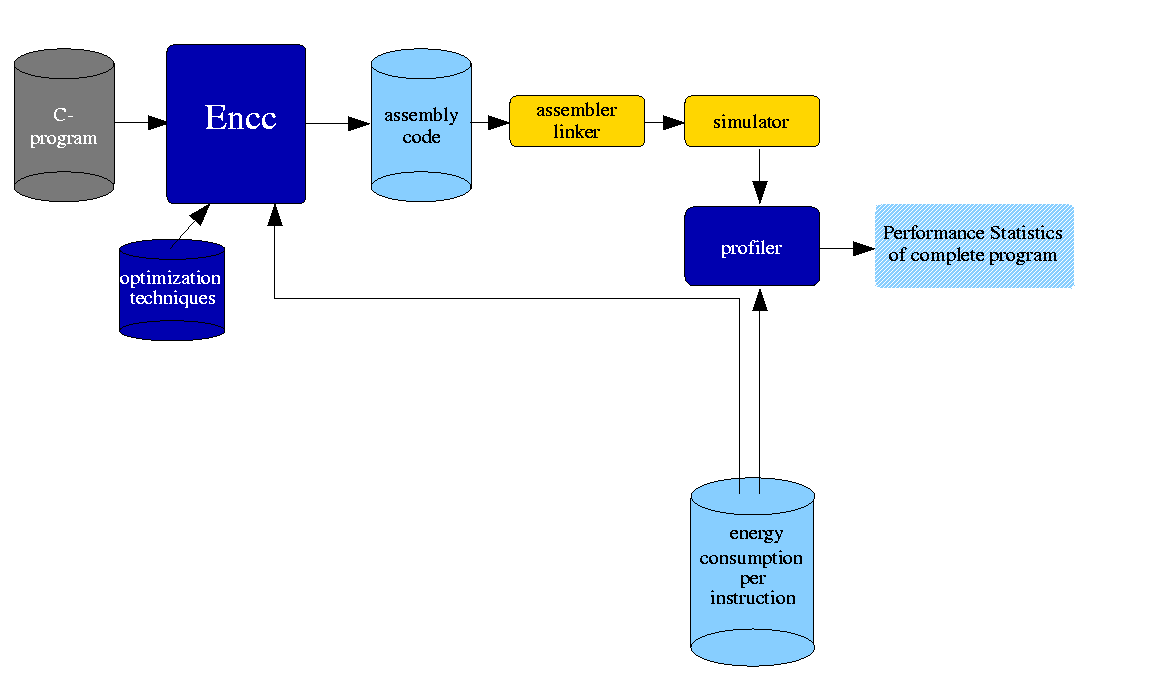
The figures on this page show the employed workflow for the use of the energy aware C compiler encc. First, an overview over the compiler itself is given. Then we show how the necessary instruction level power data is generated using two different approaches.
The meaning of the different colors used in the figures is as follows:
| Color | Meaning |
|---|---|
| grey: | external information |
| dark blue: | components developed by our group |
| light blue: | information generated by our group |
| yellow: | external programs |

encc takes a C program as its input. This program code is first processed by the LANCE frontend which includes some common high level optimizations. After code selection and register allocation, some low level optimizations like instruction scheduling, register pipelining and jump optimization are performed.
The generated assembly code is then processed by assembler and linker to form a binary executable that is executed using a simulator. The profiler takes as input the information generated by the simulator, which includes information on number and kind of executed instructions as well as accesses to different kinds of memories. Additionally, the profiler also reads from a database that contains information about the energy consumption of each individual instruction as well as memory accesses. The individual values are summed up, considering inter-instruction effects, and the final result, the performance statistics of the complete program, is generated. These statistics include the number of executed instructions, number of cycles, number of accesses to different kinds of memory, memory footprint of the program and finally the energy consumption.
In the next figures, we show how the information in the energy database was obtained using two methodologies.

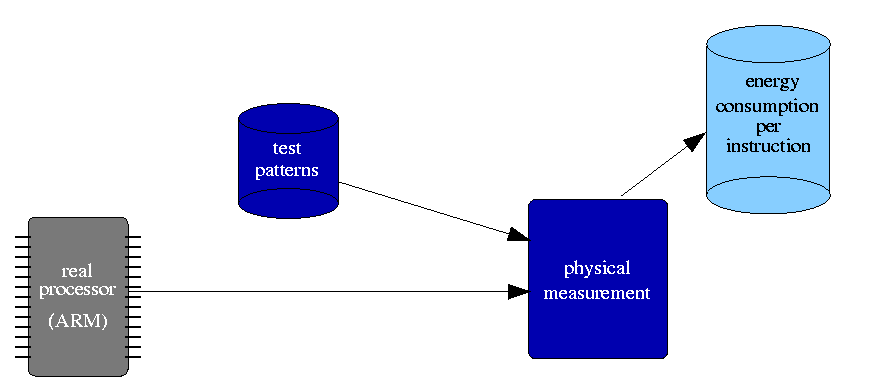
In order to obtain an energy model for the ARM7TDMI, physical measurements had to be performed since the processor is only available in hardware form. No low level information that might be useful for deriving an energy model, such as layout information or capacitances, is supplied by the manufacturer. In our case, we used Atmel's AT91M40400 processor which incorporates an ARM7TDMI core. The processor is mounted on an evaluation board AT91EB01. This board features some facilities to easily measure the processor current. In order to gather information about the energy consumption of external memory, the supply lines of the memory chips had to be cut and an amperemeter was used to measure the current. The evaluation board with all the necessary modifications can be seen here.
Using test patterns that mainly consisted of pairs of instructions repeated numerous times within a loop body, the current in the processor and in the memories was measured. From this, the energy consumption per instruction was calculated and put in a database that is being used by the encc compiler and by the profiler.

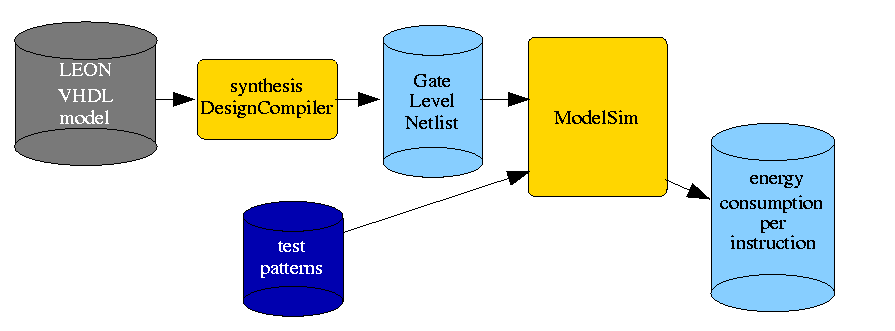
The LEON processor is available as a synthesizable VHDL model. Since no hardware version is currently widely available, the model itself, along with a VHDL simulator has to be used to gather information about the energy consumption of this processor.
The behavioral VHDL model is transformed into a gate level representation during synthesis using Synopsys design compiler. The model was mapped to the ATC35 library provided by ATMEL. This library was also used to produce the first prototype of the LEON in real silicon.
The synthesized gate level model is then simulated using Model Technology's ModelSim VHDL simulator to determine the number of toggles on the internal signals. This number is also known as 'switching activity' and is a measure for the energy dissipated by an active circuit. This information is once again stored in a database which is used during compile time and by the profiler to generate information concerning energy consumption of complete programs.

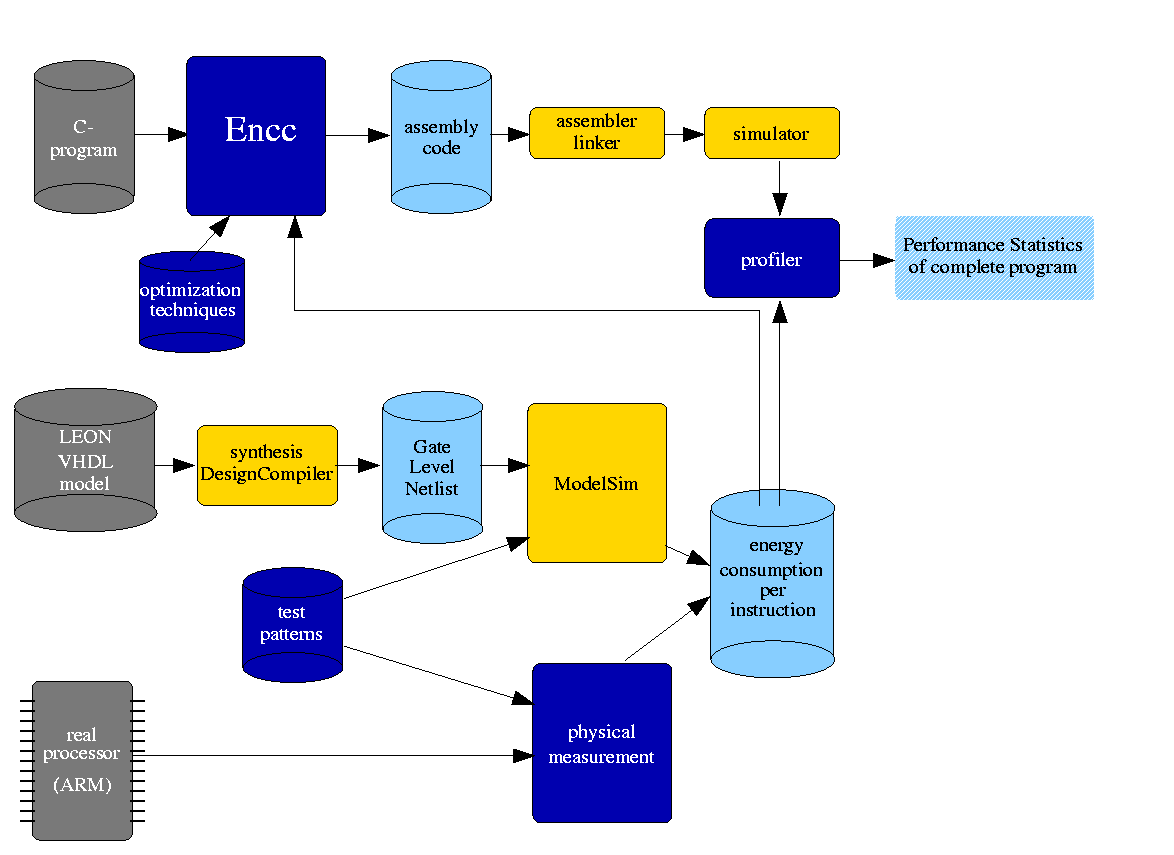
This final figure shows the information contained in the previous three figures combined into one. It shows the complete workflow employed in the encc compiler.